Module Evaluations and Related Topics

Sean van der Merwe

Introduction

Why do module evaluation?

  • A feedback loop is required to show students that their input is valued. Students may have useful insights and ideas that could improve module delivery or lecturer performance.
  • The focus is on improving at-risk modules and evaluating modules that have undergone changes (such as outcome changes or lecturer changes) while ensuring that all modules are evaluated once every 3 years or so (as practical).
  • We’re moving to two evaluations a semester:
    • first a formative evaluation with time to provide feedback and implement changes while the module is ongoing,
    • then a summative evaluation that can be used for long term planning, auditing, and lecturer teaching portfolios.

Options

  • Module evaluation can be done in different ways:
    • Have a third party go to a class and engage the students while the lecturer is excluded (ideal for very practical modules).
    • Host an anonymous forum, say on the learning management system, and ask for feedback (ideal for small modules with high engagement).
    • Formal survey system (ideal for medium to large modules).

Disclaimer: always remember that module evaluation results should be looked at in a relative sense only, not over-analysed on an individual level. Trends and sudden changes are meaningful; while a single negative comment is not.

This is because individual module evaluation responses are more a reflection of the student than the lecturer. Factors that may affect responses include: the maturity of the student, the difficulty of the module, the gender of the lecturer, and the skin colour of the lecturer.

Why a new system?

  • Survey should be tailored to our needs as faculty
  • Survey needs to be short enough to not take up student time
    • Questions must be simple and clear
  • Feedback needs to be fast enough to act on immediately, while the module is ongoing
  • Feedback must be statistically sound and informative
  • System should not be an administrative burden
    • We are all busy people

What is the new system?

  • We make a list of modules that need to be evaluated.
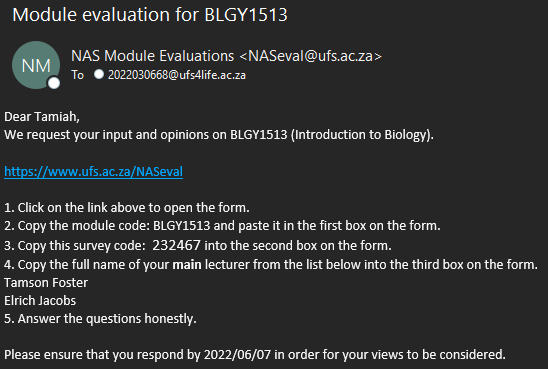
  • Each student receives two emails asking them to evaluate a specific module for which they are registered.
    • Each email contains the module code,
    • a unique survey code allocated to that student,
    • and a list of lecturers teaching that module from which they must identify their primary lecturer.
  • They copy-paste these keys onto a unified form that is linked in the email. The rest of the form consists of a few simple questions regarding the module and the lecturer.

Example email

This is one of the latest batch of 9400 or so that went out:

Responsibilities

  • Lecturers motivate their students to check their emails and respond to the evaluation requests once the requests are sent out.
  • At a chosen date the responses are filtered and processed module by module to produce reports.
    • Reports are emailed to the respective lecturers, with the ADHs receiving copies.
  • The process is almost entirely automated, requiring only that lecturers check their details each term, and that they motivate their students to respond to the emails.
  • Well, there is one problem area: the ADHs are supposed to go through the reports and send Elzmarie a summary of successes, issues, and failures; but that is not happening (yet?)

Data Source

  • The base data was obtained from Blackboard in March.
    • Blackboard is the only place at UFS where lecturers are linked to modules in a way that is fairly reliable.
    • The lecturer and module data is not perfect, some lecturers do not register their modules correctly.
    • The student data is outdated, but this is not a big deal for most modules as we do not need to contact every student of every module.
  • Blackboard does not cleanly separate lecturers and facilitators. I filtered lecturers using the faculty list.

Recap (refresh if not showing)

Details of email system

  • In order to not overload students we must generate the emails all at once:
    • First we generate a code for each student in each module to be evaluated.
    • Then we go student by student and choose a maximum of two modules for that student.
      • Modules are chosen randomly, using inverse class size as weights.
      • So smaller classes get a higher proportion of students emailed,
      • While large classes still get enough emails going out,
        • Even in situations where groups of students all have the same modules.
  • Microsoft limits me to 1000 emails per day, so I send the emails over 11 days or so, starting early enough that the students all get enough time to respond.

Processing responses

  • Every time a student responds to the survey a row of data is added to an Excel file on my computer.
  • One module at a time I look at all the responses that are valid for that module.
    • A lot of programming is needed to clean the student inputs and match them up to modules.
    • I must balance the need to catch all valid responses with the need to block malicious responses (stop review bombing).
    • I must also use the latest text matching algorithms to figure out the most likely lecturer for each student.

Details of report system

  • I then run the valid responses through an advanced processing template to produce a Word report for each lecturer + module combination.
    • The report includes table summaries, visual summaries, comments, some disclaimers (mostly pointing out all the problems with module evaluation in general), and then the responses themselves.
  • The reports all go on a pile that then gets emailed out to the lecturers, with HoD cc.
  • Assuming no errors, the above steps are implemented using one click of a button 😀

Brainstorming

Ideas for improvement: easy stuff

  • I would love to make timely Blackboard registration a strict requirement for participation in 2023.
  • The data required a lot of cleaning at the start of the year, but should be easier in future if we can figure out a good way to only update the database (not start from scratch).
  • The data base could theoretically be moved to a central location, like the faculty SharePoint page, so that everyone can view the latest version at any time, and request updates at any time.

Main issue: response rates

  • The best response rates occur when lecturers sit students down in front of PCs, or make them take out their phones, and encourage them to respond on the spot (during class or practical time).
    • However, this is an administrative burden on lecturers again, and disruptive.
  • It is possible to create a list of students who did not respond to even one email they were sent, and a list of students who responded to all emails they were sent.
    • A penalty, or bonus, or both, could be implemented based on these lists in future.
    • But how exactly?

Microsoft Forms

Why Microsoft?

  • UFS Staff are used to Microsoft products, particularly Windows and Office
  • So ICT Services have negotiated an education license with Microsoft for us to be able to use them as we like
  • Our license includes a whole lot more than just Windows, Word, and Excel
  • Microsoft products talk to each other really well
    • Especially when everything is in their cloud
    • Forms can store the responses in an Excel file in OneDrive or SharePoint
    • Power Automate can read information from an Excel file in OneDrive and tell Outlook to send an email for each row in a table

How does this help with module evaluations?

  • Generating the email contents and generating the reports are complex processes that require programming to be implemented neatly.
  • The programming is created and run on my computer.
  • The rest of the steps can run easily in the cloud based on simple rules.
    • The rules can do repetitive tasks like reading an Excel file and doing something for each row.
  • The key connection between the two is OneDrive
    • Forms (+Power Automate) write data to OneDrive.
    • My programs read data from OneDrive, process it, and write the results to OneDrive.
    • Power Automate reads the results from OneDrive and sends them out via Outlook.

Hands on: classroom clicker

As a practical exercise let us make a basic classroom clicker for capturing student responses to questions in class.

  • First open office.com and log in using your staff email and password.
  • Find and open the Forms app
  • Create a new blank form and add questions
  • Customise, e.g. change colour to #0F204BFF
  • Test it out by putting in a few fake responses
  • Get to the raw data in Excel and add a pivot chart

Microsoft Power Automate

What can it do?

  • It creates interaction between programs and repeats tasks.
    • Mainly it works between Microsoft programs, websites, the cloud, and some other special tools.
  • If you have lots of people email you the same type of things you can have it process those things automatically.
    • Like saving attachments to a folder automatically (say student submissions).
    • Or automatically responding to common requests.
  • It can also do some special things of its own, such as approval processes.
  • It is sort of like a programming language, but point and click, and friendly colours.

How is it used for the module evaluations?

  • If a lecturer requests a change on the module list then it sends me an approval request (on 3 platforms), with easy Accept and Reject buttons, only adding the information to my to-do list if accepted.
  • If a student fills out the module evaluation form then it captures the information in my Excel workbook.
  • It handles the process of sending the emails to the students, based on information in an Excel file I created.
  • It handles the process of sending out the reports to lecturers, reading them from OneDrive.

Demonstration of approval process should happen here.

Practical examples

  • Screenshots and words do not capture the essense of Power Automate well.
  • At this point your presenter would like to show you the following live:
    • How to access Power Automate
    • How various flows are constructed
    • Details of the module evaluation flows
    • Examples of other flows that might be useful
      • Like a flow to catch the clicker responses
      • Or a flow to clear the clicker responses after class (possibly making a backup first with a datestamp)

Markdown and notebooks

One tool for everything

  • Markdown is a tool that simplifies procedural document preparation systems.
    • Think LateX, or LyX, but much simpler and yet more powerful at the same time.
  • It boils down to programming a document by typing what you mean.
    • You can integrate text, formulas, code and results all in one, no copy-paste needed.
  • I use it for teaching, assessment, research, consultation, websites, presentations, and module evaluation systems 😉
  • The specific platform I use is R Markdown, powered by the open-source R language.

Assessments

Example: Quiz question pool

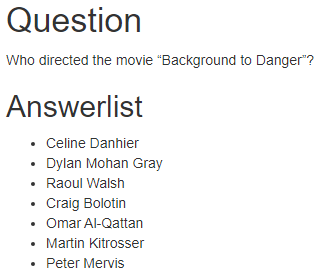
  • Suppose you want to test students’ internet search skills.
  • You could ask a question like the one on the right:
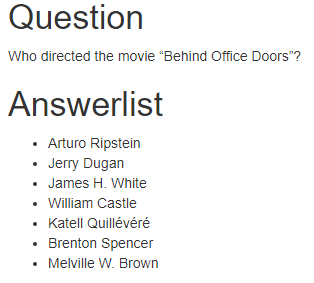
  • But now the first student looks it up and shares with the rest, defeating the purpose.
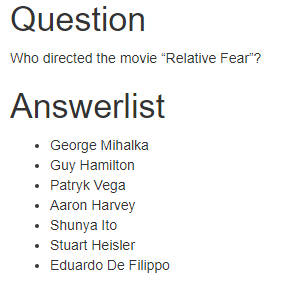
  • One solution is to have each student get a different movie and options.
    • If you have 1000 students you need 1000+ questions, manually doing this is not an option.
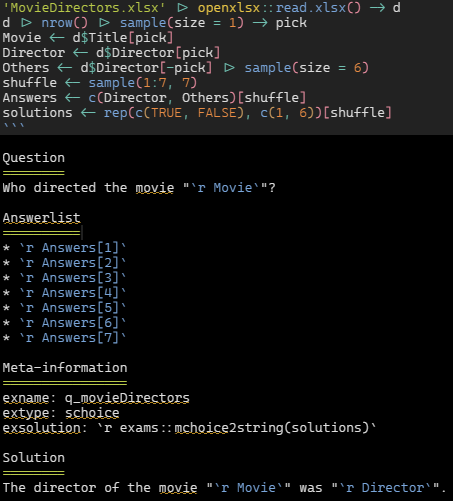
    • Instead we program the question, picking a movie, the correct director, and a bunch of wrong directors at random.

Example: Quiz question pool code

  • I created an Excel sheet with lots of movies and directors from the internet.
  • I then write a little block of code that picks one at random, getting the title and director.
  • I then pick 6 random directors from the rest. I shuffle the 7 directors, remembering which one is the correct one.
  • I type the question itself, putting easy code in key places in the question text.
  • The final step is to request say 1000 different copies, nicely zipped up for easy upload to Blackboard.

exams::exams2qti21("q_movieDirectors.Rmd", n = 1000, name = "MovieDirector", points = 5)

Simpler example: averages

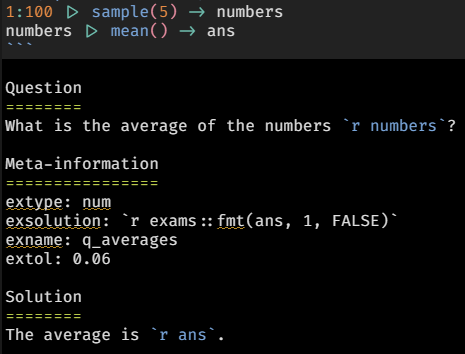
  • In this question we just generate a few random numbers and ask the students to calculate the average.
  • The question presented to the students is just:
    • “What is the average of the numbers 70, 67, 56, 23, 31?”
    • Except that every student gets their own numbers.
    • The solution section is optional, but it is nice to give feedback.

  • This is inspired by the ‘calculated’ question option that started with WebCT (which I used in 2006 already) but is way more powerful because it leverages R.

Random fun with plots

Because we now have the power of R available we can do just about anything.

  • We can have questions with random plots:

“Which one of the following four time series is most likely to be stationary?”

Random fun with maths

“Let \(X\) be a random variable on the domain 0 to 1, with density function \(f(x) = 1 (x^2 + 4/3 x)\). What is the \(P[X> 0.3]\)? [Accurate to 3 decimals]”

Solution:

\(F(x)=1\int_0^x u^2 + 4/3u = 1\left[\frac{1}{3} u^3 + \frac{4/3}{2} u^2\right]_0^x = 1\frac{2x^3 + 3*4/3*x^2}{6}\)

\(P[X>0.3] = F(1) - F(0.3) \approx 0.931\)

“Let \(X\) be a random variable on the domain 0 to 1, with density function \(f(x) = 2 (x^2 + 1/3 x)\). What is the \(P[X> 0.3]\)? [Accurate to 3 decimals]”

Solution:

\(F(x)=2\int_0^x u^2 + 1/3u = 2\left[\frac{1}{3} u^3 + \frac{1/3}{2} u^2\right]_0^x = 2\frac{2x^3 + 3*1/3*x^2}{6}\)

\(P[X>0.3] = F(1) - F(0.3) \approx 0.952\)
Larger assignments

  • For assignments I generate random data for each student (with the same structure) and put it in an Excel file with a sheet named after every student.
    • Using a few lines of R code, I don’t actually need to open Excel at all.
  • I then create a memo with questions and answers based on the data of one student, in RStudio.
  • When I click a button it asks for the student number and generates the memo for that specific student, as a Word document or PDF.
  • So I can give the students (and markers) one file from which each can get their own personal memo.

Teaching

Interactive classes with instant notes

  • In class I sometimes create examples on the fly using interactive tools, typing explanations, maths and code between each other.
  • At the end of the class I click a button and get a PDF summary of the class to post on Blackboard.
  • For example, to teach multivariate simulation I found the following line of code on a website and used the graph to teach some concepts:
plotly::plot_ly(z=~volcano) |> plotly::add_surface()

Consultation

Survey reports

  • I’ve had to analyse surveys with hundreds of questions.
  • Clients need reports that have tables, plots and other summaries.
    • Of course the reports must still be easy to navigate and in a format they are used to, usually Word.
  • Since the Word document is created by processing ordinary text, that text can be meta-programmed.
  • So a report of hundreds of pages can be created by a bit of code that fits on one page.
  • The best part is when the client sends updated data and I can produce a new report in seconds.

Presentations

Interactive presentations

  • The most fun part is creating interactive content.
  • My website was created in RStudio.
  • This presentation was created in Quarto in RStudio.
    • Quarto allows you to use R, Python, Julia, LateX, Javascript, HTML, and similar stuff in the same document!
    • You type your content once, then go from rendering HTML to PowerPoint to PDF with a single step.
      • The power comes from typing what you mean and letting the tools do the hard work of actually making a presentation.

Module evaluation system

Report generation

Coming back to our main topic…

  • I created a report framework with all the text, headings, links, and structure that is common in all cases.
  • I then include R code that processes the survey data of a specific module plus lecturer.
    • The code produces summaries, plots, tables, and so on.
    • R is unquestionably the best tool for this process, by far.
    • I can then click a button to get a Word report for a module.
  • I take it a step further: I write another block of R code that compiles the report for module after module in a loop, each time telling R to process the report as if I was pressing the button and manually telling it who the lecturer is (and module code).

Conclusion

The end

To anyone still here and awake, thank you for your time and attention!

I really hope I could inspire some people, or at least broaden minds as to what is possible.

As a final step for anyone still here,

  • we can discuss the details of the reports and how to interpret them,
  • or brainstorm any other components or processes you like.