Q: What is the best format for the data?
A: Formats that can be opened using free software are better. A good format for small samples is .csv, for medium to large samples use .xlsx or .ods say. Very large samples should be in a database.
However, ensure that all metadata is also provided, either in separate sheets or separate files. This includes the source of the data and a description of how it was collected, detailed descriptions of all variables, descriptions of categories for categorical variables, any codes and jargon used. In the case of a survey, a copy of the survey as presented to respondents must also be given.
Example: if EvaSys was used for a survey, please export the data in ALL formats and provide them all to the statistician along with the survey and reports that EvaSys produces. You cannot provide too much information.
Q: How should the data be arranged?
A: All statistical packages (including Excel, R, SAS, Statistica, SPSS, etc.) prefer data to be arranged on a single sheet with unique short headings in Row 1 ONLY and data arranged in rows from Row 2 down. There should be nothing else on the sheet. If the same type of measurement is done on multiple groups then all those measurements should be in one column with a separate column indicating the group to which the measurement belongs.
Create a second sheet with a table of the unique short names in one column and full descriptions in a second column. Other columns can include groupings, medium length names, units, transformations, notes, etc.
Q: How should the data be coded?
A: It shouldn’t!
Groups, categories, types, or labels should be entered as text, but the text must be perfectly consistent. For example, in a survey a response of ‘Disagree’ is not the same as ‘disagree’, nor ‘Disagre’, nor ‘Disagree ’.
Q: What’s a p-value?
A: The approximate probability of observing patterns in your data at least as interesting as the patterns you see, under the assumption that there actually aren’t patterns and that the data generating mechanism is rather boring (the patterns you see are just coincidence).
Q: What use is a p-value?
A: In a well designed experiment, a small p-value provides evidence against the null hypothesis of boringness. A small p-value says that the patterns you see can probably be extended beyond your experiment to some extent and may continue into the future.
Q: When is a p-value bad?
A: When the odds of the patterns being real versus not being real are unbalanced going into the experiment. A perfect experiment is unbiased prior to collecting data. A good experiment also has the power to detect patterns when they are there and not detect them when they are not. If the assumptions of the analysis are not met then the p-value can give twisted results.
Q: How can I test a possible cause of an effect?
A: To determine whether a cause leads to an effect you must meet two conditions:
- The cause must happen before the effect. That means the effect must be missing or weak before the cause and present or strong after the cause, given everything else stays the same.
- Everything else must stay the same. You must have groups that are essentially the same in every respect that is relevant to the effect being studied, except for the cause.
The optimal way to create this situation is a randomised controlled experiment. Subjects are assigned to treatments (causes) in such a way that the groups have identical characteristics (within reasonable random variation) and then all groups have measurements taken before and after treatment.
Sometimes randomisation is not possible or ethical. In that case one can try to analyse only before and after measurements for the same subjects, confounding treatment with any natural time effect, OR one can use a matching technique. Matching tries to create two identical groups retrospectively. It is a complex process requiring very large samples and often doesn’t work as well as randomisation.
Q: Are surveys useful?
A: A bad survey tells you only about the people that answered the survey. A good survey tells you only about people like the people that answered the survey. To get information about the general population you need a designed experiment. A survey can be raised to the level of a designed experiment with careful planning and execution, but I’ve not had the priviledge of seeing this in person.
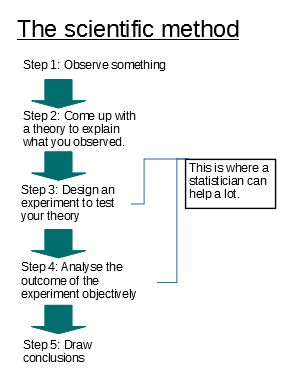
Q: What is the scientific method?
A: The scientific method is a sensible way to learn about the world.