2020 February 7
Surveys, surveys, surveys
Oom en Tannie
- Put up your hand if you used or even heard ‘oom’ or ‘tannie’ in 2019
- These words are used often in Afrikaans communities
- Their use is controversial in that a lot of people take offense when refered to using these words, especially in the wrong context
- Carla Ellis at the UFS Department of Afrikaans And Dutch; German And French is doing her PhD on these words
- She is looking at mother tongue speakers only*
- Let’s look at some quirks of its use
Oom en Tannie usage in general
- We consider statistically significant results only
- Positive numbers indicate agreement and regular use, with 2 being ‘always’ or maximum agreement
- Negative numbers indicate disagreement and lack of use, with -2 being ‘never’ or total disagreement
8. Ek gebruik “oom” en “tannie” (en/of wisselvorme):
- School going speakers 1.5, middle aged speakers 0.8, older speakers 0.5
- Bloemfontein 1.6, George 1.3
- Men 1.3, women 1.4
Oom en Tannie: family vs strangers
13. Ek gebruik “oom” en “tannie” vir familie:
- 18 to 50 is high (1.5), younger and older is less (1.1)
- Women slightly more (1.2 vs 0.9)
14. Ek spreek vreemde mense (mense wat ek nie persoonlik ken nie) as “oom” of “tannie” aan:
- Less than 25 is high (1.1), middle aged neutral (-0.1), and older people negative (-1)
- No gender difference
- Bloemfontein people more likely to use it with strangers (1.4 vs 0.9)
Oom en Tannie not old fashioned
19. Dit is outyds om “oom” en “tannie” te gebruik:
- All ages disagree (-1) with the statement, so they all agree that it is still acceptable and not old fashioned
- Gender, race or area differences are statistically significant but the effect size is practically tiny
18. Dit is outyds om titels (bv. meneer/mevrou) te gebruik:
- All ages disagree (-0.7) with the statement, so they all agree that it is still acceptable and not old fashioned
- However, UFS Lecturers should abide by the UFS English Style Guide in all official documents and communication (like emails to students, parents, suppliers, etc.)
Inflated Zeros
Opportunistic Potatoes
Opportunistic potatoes are a pest that affects farms in many negative ways and need to be controlled. This experiment attempts to find the economically optimal dose of a specific treatment for this purpose.
In the original experiment 8 measures were taken for various cultivars and doses, but we will restrict ourselves to only one measure and combine the cultivars for this discussion.
This research was done by Talana Cronje, UFS, on behalf of Potatoes South Africa.
They applied the treatment at various proportions of the recommended dose. Lower proportions are cheaper to implement.
Visualise the data
You must enable Javascript to view this page properly.
Solution
- Looking at the data, it is clear that the economically optimal dose is near 20%.
- More than that costs more money but doesn’t yield much improvement.
- After 40% there doesn’t appear to be any real improvement.
- No need for a complex cost function analysis in this case.
Can we get the same answer more formally?
Bi-phasic regression
I propose the following model:
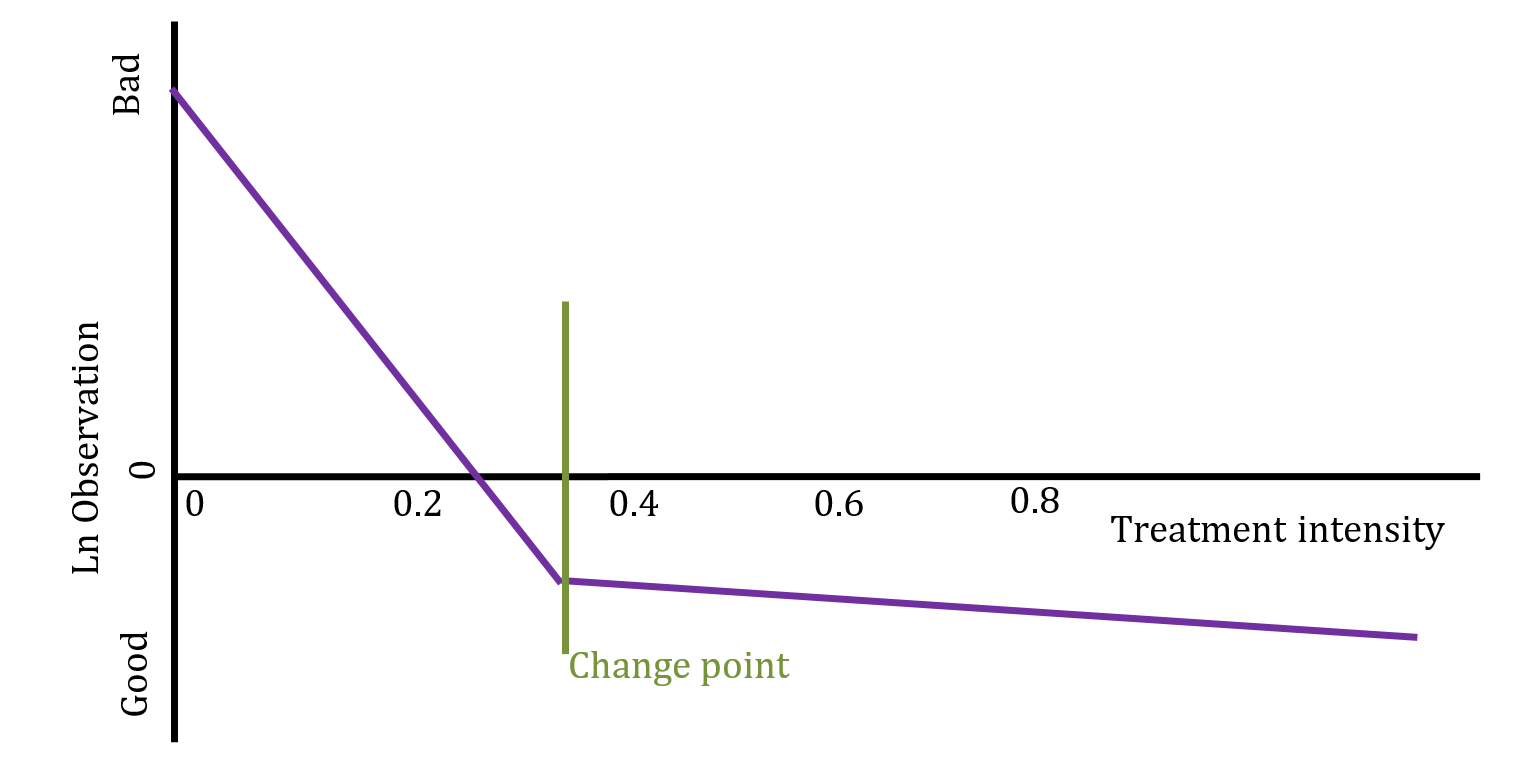
Model results
Given an unknown changepoint \(\gamma\), the model is formally defined as \(y_i\sim N(\beta_0+\beta_1(x_i-\gamma)I(x_i>\gamma)+\beta_2(x_i-\gamma)I(x_i<\gamma),\ \sigma^2)\).
- By far the easiest way to fit the model (in my opinion) is using STAN, via rstan
- In STAN you write the model like you write the maths, and it does the work
- The p-value for the changepoint test is: 0.0047 and for the test of a flat slope after the changepoint the p-value is: 0.6583
- Which means we assume there is a changepoint
- with expected value 24% of recommended treatment
- and 95% HPD interval of 10% to 42%
Why are people obsessed with averages?
Which is the best species to plant?
- You have a choice of over 200 types of wheat to choose from for planting
- and that’s only considering types easily available in South Africa
- How do you know which is the best?
- Suppose you specifically care about resistance to infection
- A UFS PhD research project seeks to answer that
Procedure
- They plant a line of non-resistant wheat and infect it with a specific pathogen
- Next to that they have a line of supposedly resistant wheat
- Once the plants have grown, they measure (badly in my opinion) how much resistance the plants put up
- They use a big field and plant infection, wheat 1, infection, wheat 2, infection, wheat 3, and so on …
- They did this for fields in very different places over multiple years
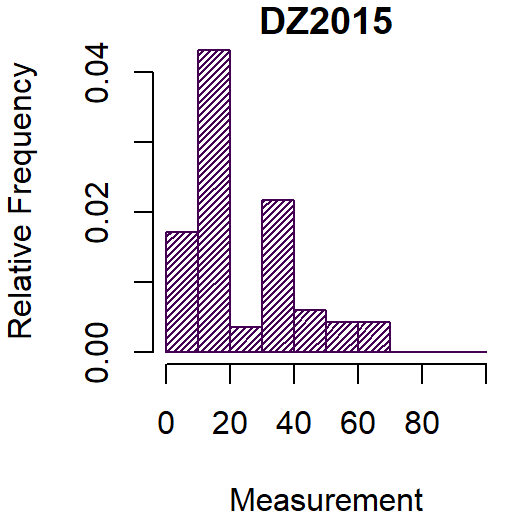
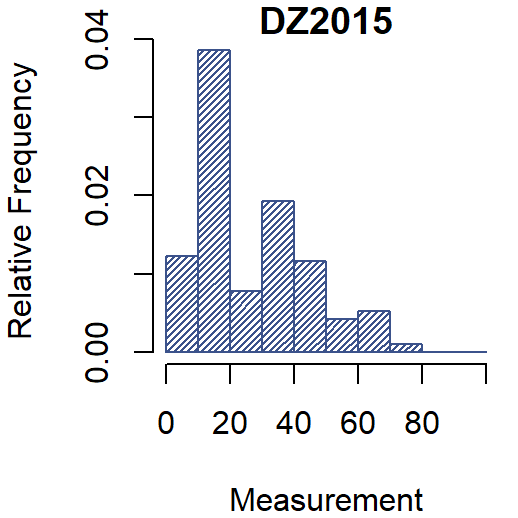
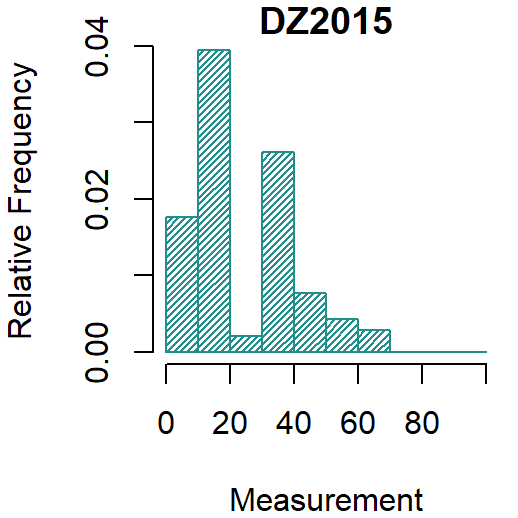
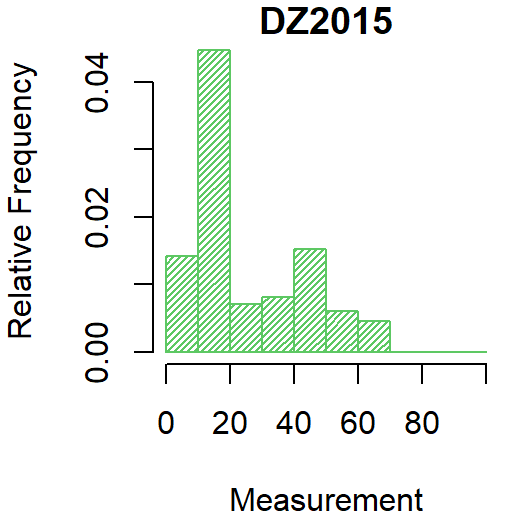
Data
| LineName | Year | Site | CI |
|---|---|---|---|
| PRYSYN-IC/ET-09-6 | 2015 | DZ | 12 |
| PRYSYN-IC/ET-09-407 | 2015 | DZ | 9 |
| WHEATEAR//ACHTAR/INRA 1764 | 2015 | DZ | 24 |
| PRYSYN-IC/ET-09-6 | 2016 | DZ | 12 |
| PRYSYN-IC/ET-09-407 | 2016 | DZ | 20 |
| WHEATEAR//ACHTAR/INRA 1764 | 2016 | DZ | 65 |
| PRYSYN-IC/ET-09-6 | 2015 | KL | 3 |
Actual problem
- For a general field, in a general year, facing a general pathogen, which type of wheat is generally the most resistant?
- Right now they just take an average
- External assessor on the PhD said that’s not good enough
- Came to me to ask my opinion
- My answer was, as it almost always is, “it depends”
What’s the problem?

Testing
- Under the assumption of Gaussian residuals with constant variance it doesn’t matter how fancy you specify the model
- Whether I take the arithmetic mean
- Or fit a mixed effects model
- You get the same fitted effect for each type of wheat
- This is because all observations do and should carry the same weight
- But the residuals are not Gaussian (p-value = 0.001822)
- And the variance is far from constant (p-value = 0.00000003093)
Is that really so bad?
- In many cases, including this one, not really
- I will show the exact impact soon
- When the tail is heavy then the arithmetic mean puts more weight on the tail
- If you don’t want that, then you must take a weighted average and put more weight in the bulk of the data
- or transform the data to fix the problem first
- When some observations are measured more accurately than others then it’s natural to want to give them more weight
- sometimes this can also be fixed with a transformation
Is there another way?
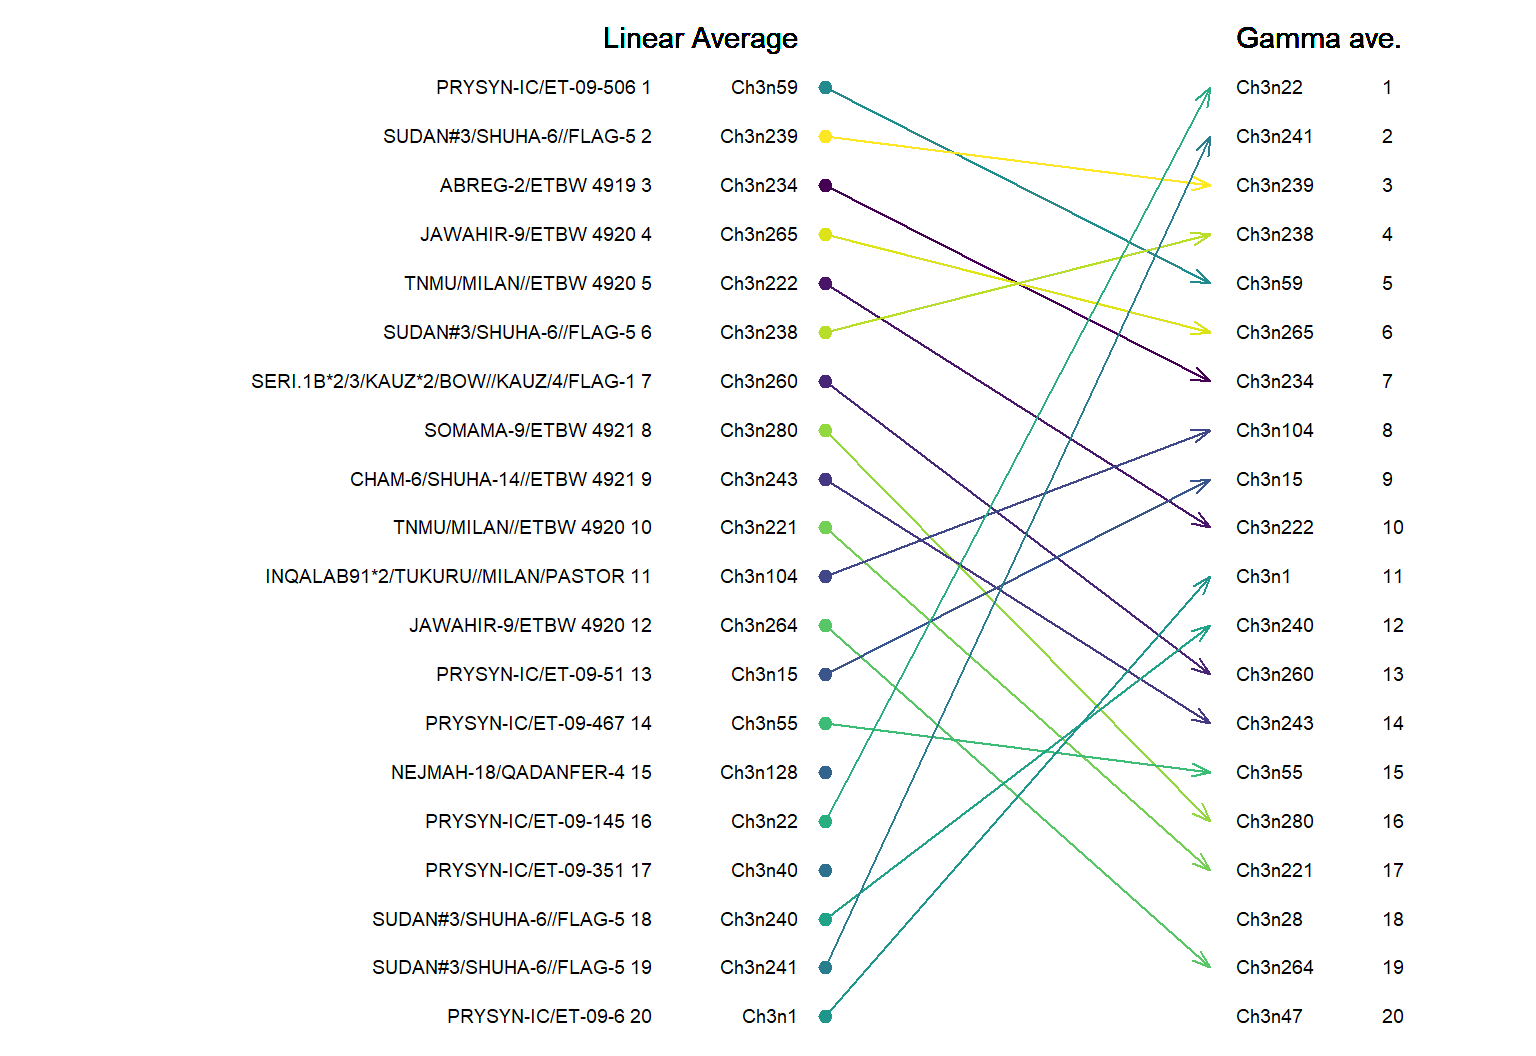
Yes, we could fit a custom model with the type of wheat as fixed effect, the conditions (site, year, pathogen combination) as random effect, a different variance for each set of conditions, and a gamma distribution for the observations
The general form of the model is:
\(y_i\sim Gamma(\alpha_i,\lambda_i)\)
\(\alpha_i=\mu_i^2/\sigma^2_{g_i}\)
\(\lambda_i=\mu_i/\sigma^2_{g_i}\)
\(\mu_i=\exp\left(\eta_{g_i} + \beta_{s_i}\right)\)
\(\eta_j\sim N(0,\tau^2)\)
\(g\) indicates the group and \(s\) the subject, so \(\exp(s_1),\exp(s_2),\dots\) is what we are interested in
Impact (on top 20 out of 285)
Conclusion
Thank you for listening
- Some projects are fun and interesting to work on
- I am going to need help with the projects coming in over the next few months, please see if you can spare a few hours somewhere