2020 January 30
Reproducibility?
Why?
- Put up your hand if you have made something that works great when you use it; but fails when you give it to someone else
- Good products are ones that work for the customer
- and keep working into the future (generalisation)
- even after you’ve moved on from the project
- In time the needs of the customer will be different but a really good product will still meet them
Buzzwords
- Robust, Extensible, Intelligent, Adaptable, Stylish
- Nice to have but useless without the basics:
- Does what the client needs
- Works
- Easy to use
- Readable source
- It doesn’t matter how stylish your product looks, if the next person that has to work on it can’t make sense of what you did then your work will be disregarded
Same applies to everything
- The truth has a tendency to reveal itself eventually
- No matter how much marketing hype is attached
- Marketers are quick to market the importance of marketing
- But what is the impact of marketing really?
- How do you measure it?
- Will it be the same on the next project?
- Everybody who invents something new thinks everybody in the world needs it, but do they really?
So what’s the answer?
The scientific method:
- You observe (desire) something interesting
- You come up with a theory (product) for that thing
- You devise an experiment to prove yourself wrong (product bad)
- You perform the experiment objectively
- If the experiment succeeds you learn from it and then you start over
- If the experiment fails you share your theory (product) widely as something that can be trusted
The other way round is much easier; but less convincing
What to test?
- If you only test the best case, then you have no idea what will happen in general
- If you only test the worst case, then your focus will be entirely on robustness
- You need to evaluate your product for the things that actually matter
- Opportunity for discussion
Product evaluation
Surface
- When ordinary people think web design they think aesthetics
- They don’t think your website looks as good as you do
- Resources are available to help you if you just want to quickly review your work
- Overview of web design evaluation
- Website design checklist
Depth
- Official international standards for software product development
- Even if you only care about aesthetics you can go very very deep
- Focus groups are extremely popular in web development
- Focus groups are easy
- You can ask you mom, your friends, etc.
- But focus groups will lie to you
- They lie less if it’s impersonal, so get someone else to do your focus groups for you
- You have to ask the right questions
- It’s nearly impossible to get a representative sample
Beta testers
- Paying people to test your products will reveal flaws en mass
- Helps make your work more robust
- But not fool proof (fools can be really ingenious in their foolishness)
- Usually can’t tell you if you met the clients’ objectives
Surveys are opinions
Evaluations you can trust
- To show that A causes B you must:
- Show that B happens after A happens (effect over time)
- Show that B doesn’t happen if A doesn’t happen (control)
- Show that your experiment generalises
- The absolute best way to test something is the randomised controlled trial
- In the case of medicines it’s really expensive
- In web products it’s much easier
The right way to test something
- Create (at least) two groups that are identical in all ways that matter and representative of the wider audience (randomisation helps a lot here)
- Treat one group one way and the other differently (or not at all)
- Measure the effect over time for both groups
- Contrast the effects
- Discuss
Hypothesis testing
General idea
- Assume the world is boring
- See something possibly interesting
- Work out how likely it is to see something at least that interesting under the assumption that the world is boring
- This is called a p-value
- If the p-value is large (say more than 0.05) then we keep assuming the world is boring
- If the p-value is small (say less than 0.05) then we reject our assumption that the world is boring and conclude there’s at least one interesting thing going on
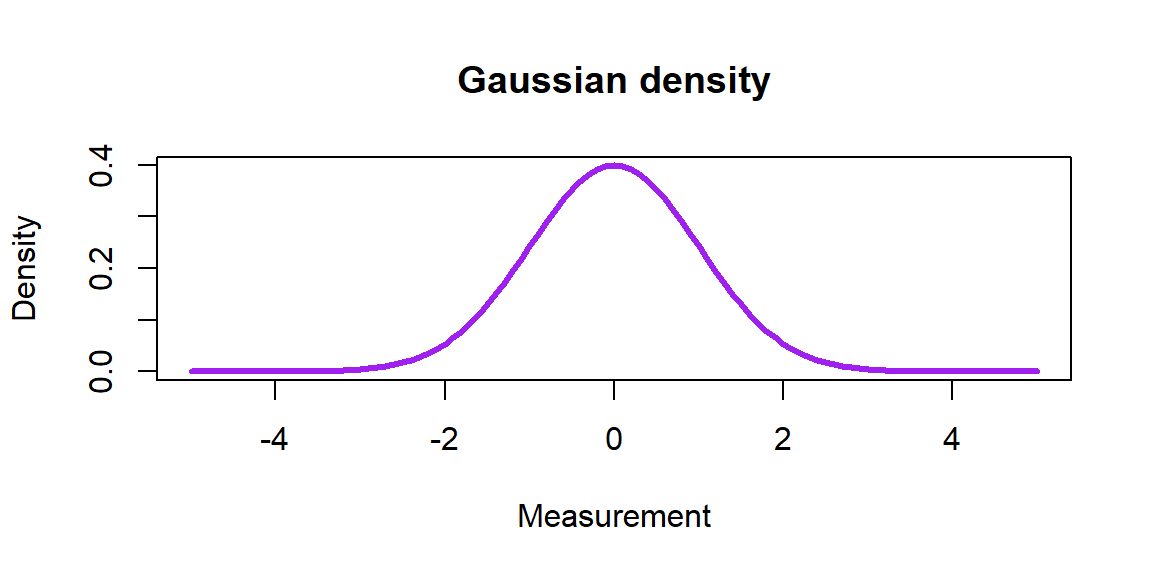
Distributions
- The Central Limit Theorem says that averages follow a Gaussian (Normal) distribution
- So if we care about the average then we can make judgements using this theorem
t-test
- The t-test is the most popular tool in statistics after summary statistics and graphs
- Assuming you are interested in testing some hypothesized average \((\mu)\)
- Usually “No difference”, implying an average difference of zero \((\mu=0)\)
- IF your sample size is large enough then
- \(t=\)(The average minus \(\mu\))*\(\sqrt{n}\)/standard deviation
- Follows a \(t_{n-1}\) distribution in a boring world, where \(n\) is the number of observations
- So if \(|t|\) is large (>2 is a good rule of thumb) then we reject the boring hypothesis
Intervals
- Point estimates are always wrong
- If you keep doing tests you will ‘find’ something sooner or later
- A much better way is to report results with uncertainty
- A basic 95% interval for the average is \(\bar{x} \pm t_{0.95;n-1}*s/\sqrt{n}\), where \(\bar{x}\) is the average and \(s\) is the standard deviation (how far the observations deviate from the average on average)
- It says we are 95% confident that the general average for the whole population is within those bounds
- The closer your data pattern is to that Gaussian density graph the smaller sample you need for these results to hold
Self-sampling
Basic bootstrap sample
- What if you don’t want to make assumptions, or you’re not working with an average?
- You could ask a statistician for help, just saying
- You can try bootstrapping
- It only assumes that your sample is representative of the population (very few are)
- The term comes from the idea of pulling yourself up by your own boots
- It means you randomly take new samples from your current sample, the same size as your original sample, with replacement
- Some values will be picked twice and others not at all
Bootstrap intervals
- Take a lot of bootstrap samples
- For every bootstrap sample you work out your statistic
- Like the median, which is better than the average for skew data in some ways
- Sort those lots of statistics
- Take the values in roughly positions 0.025 and 0.975 of the way through the list as your interval
- Or try every interval with 95% of the sorted observations between them and find the shortest one
- These intervals give you a good idea of how certain you are about the thing you are measuring
- If your hypothesis doesn’t fit in the interval then you reject it
Conclusion
Thank you for listening
- We live in an uncertain world
- Things are random
- If you talk to different people (or even the same people again) you will get a different answer
- Instead of worrying about uncertainty, measure and report it!
Now let’s get practical and do some examples together!