Beyond multivariate applications: Quarto for reproducible interactive documents
Sean van der Merwe, Johané Nienkemper-Swanepoel, Raeesa Ganey
Introduction
For the second part of the workshop:
- Details matter, so ask questions immediately if you don’t follow
- No, you don’t have to remember everything, you can refer back to these slides, but the more key concepts you remember the better
You can access Part 1 of the slides at seanvdm.co.za/mdag2025 and on the last slide of Part 1 you will find a link to all the resources for the day, including Part 2.
Part 2 - Details
How do you get this power for yourself?
Should you even try to get this power? Isn’t is dangerous?
What are the downsides to interactive materials?
The biggest downsides are obvious when you try to distribute it:
- Interactive materials are great for slow exploration, not for scanning
- It is not immediately obvious what the author wants to convey
- It allows for the audience to draw their own meaning and interpretation
- Requires that the recipient understands that they are meant to interact with it
- More difficult to email or send, but not impossible
- Interactive formats are designed to be hosted, not distributed
Static Formats
- Microsoft Word (.docx) and PowerPoint (.pptx)
- Used in industry in most of the world
- A lot of precise control (often a bad thing)
- Great for quickly creating short documents with precise formatting, like business letters, position statements, and assignments
- For longer documents the use of styles is essential to avoid a mess
- Alternatives include OnlyOffice, LibreOffice, Google Docs
- Portable Document Format (.pdf)
- Extremely precise control of everything
- It has no concept of paragraphs, it’s just letters, lines, and pictures
- Do not create documents in this format, only convert and manipulate
Interoperability
PDF and HTML are absorbing states, Word nearly so.
What powers all the flashiness?
The interactivity is brought to you (under the hood) by JavaScript. You do not see it - it is very well hidden, but it is working in the background to display the figures and react to your inputs.
The JavaScript accompanies (or is embedded in) HTML. No, you do not need to know any HTML at all, just like you don’t need to know that a .docx is actually a .zip containing .xml files.
All you need to learn is Markdown and a little of your favourite scripting language (e.g. R).
Markdown
- Markdown is the new (2004) language of the technical internet
- Places like GitHub, Reddit, StackExchange have supported it for a decade
- It is deliberately simple and easy to use
- You type what you mean and let the interpreter do the formatting
- It is made to be readable without needing to be converted or formatted
- GAI Chatbots write in Markdown!
Technicalities shouldn’t matter
- The literate programming principle (made popular by Donald Knuth in the 90s via LaTeX) suggests that it is faster and easier to just type what you mean rather than fret over every detail
- ChatGPT doesn’t understand the difference between a table and a code block, or a heading and a bold statement
- it is just generating text
- Yet you see neatly formatted output!
- This is one area where you can really learn from AI: it doesn’t touch the mouse to create math and neither should you
- Doing things manually wastes so much of your time
My workflow
I do almost all my work directly in markdown
- For consultation clients who use Word I give explanations, references or links, math (e.g. model definitions), code (optional), results (tables and figures), interpretation, and sometimes statistical conclusions by just typing text in one text file
- I then press a button and get a perfectly formatted Word report with structure, table of contents, etc.
- For research I do the same, but choose the PDF option to get both a neat PDF and raw LaTeX + figure files
- For teaching I create all my assessments via markdown, including assignments, tests, quizzes, etc.
- In class I type in markdown to explain concepts live and demonstrate principles
- As department head I write letters and implement processes via markdown
Let’s learn markdown quickly
- Hashes make headings, 1 for a 1st level heading, 4 for 4th level, etc.
# This is a big heading,## This is a smaller heading,###### This is a tiny heading# This is a section slide heading,## This is a normal slide heading
<https://www.this_is_a_link.com>,*This is italics*,**This is bold**[This is a fancier link](https://pointing.to.this/)
>starts a quote,-creates a bullet, and numbered lists are just1.
Other easy things you can do without code
Text with borders, perhaps in columns
Note
A note
Warning
or a warning, perhaps with a highlight
Static diagrams
Interactive diagrams are fun, but require detailed specification. Simple diagrams can be done really fast with just basic labels:
flowchart LR
    A{Is Y continuous?} -->|No| B(Table)
    A -->|Yes| C{Is X1 continuous?}
    C -->|No| D[Box plot]
    C -->|Yes| E[Scatter plot]
What about code
- Code blocks start and end with 3 backticks, such as
```{language options} some code ``` - “language” and “options” depend on the interpreter
Quarto supports a lot of languages but I typically use R, Stan, CSS, and HTML only for my work.
- The most powerful option (use carefully) is “results: asis”
- which tells Quarto to process the output of the R code chunk as if it was part of the markdown document
- This lets you create many pages of document from a single code block!
Technicalities that matter
- There are not many technicalities - it typically just works
- I could turn this presentation into a regular web page by only changing a few words here and there
- A few more small changes and most of the presentation could be a Word document (or PowerPoint or Beamer)
- I’d lose the interactivity though
- A few more small changes and most of the presentation could be a Word document (or PowerPoint or Beamer)
- The more detail oriented you are the more small technicalities you will come across, most are easy to address though
- Here’s the most important issue in my view:
Graphics formats
Every target format has ideal graphics formats for plots.
Word or PowerPoint
My recommendation
Enhanced Metafile (.emf)
Catch: Requires the devEMF library, e.g.
You can try the Windows Metafile (.wmf) format instead, which is built into R. It usually works but is buggy sometimes.
Or you can use Scalable Vector Graphics (.svg) which works great in Office 365 Desktop.
PDF (LaTeX based)
My recommendation
Portable Document Format (.pdf)
Catch: only works with PDF rendering
Or you can use Scalable Vector Graphics (.svg) which works in theory but might be buggy in practice depending on your editor and packages.
RevealJS or other HTML based formats
For all static plots, e.g. base plot, ggplot2, biplotEZ, …, use Scalable Vector Graphics (.svg) for the highest quality and smallest file size
- For interactive graphics you must use a JavaScript (JS) based format
- Other formats can have animations, but they are not really interactive
- JavaScript only works in HTML based formats, rendering in a browser (any)
- The script tells the browser what to do when your mouse interacts with the plot
- You don’t need to learn any JS, you just use an R library
JS graphics options
- There any many JS graphics tools
- Most are for Python. If you know Python you’ve probably heard of them already so I will skip
- There are two that I’d like to mention: plotly and echarts4r
Plotly
Plotly is the most popular, most powerful, and easiest to use by far. BUT the R package is no longer maintained and the R help files are on their way out 😢
Echarts4r
Echarts4r is new and maintained, but more difficult to use and limited in scope.
To be continued …
In Part 3 we will work through the steps of:
- Creating HTML based Quarto documents or presentations, specifically with RevealJS
- Adding plots, including multivariate plots like biplots
- Creating a nice static ggplot, then making it interactive with ggplotly
- Making an interactive 3D plot directly in plotly
- Making interactive plots in general using echarts4r
Bonus: Writing to Excel
In Part 1 we showed that we can play with data interactively on a slide for basic exploration. What if you need the audience/students to actually work with the data though?
What if you want to generate or prepare data for students?
You might think, “Let me make it look nice manually by opening it in Excel,” but then you decide to generate new data and you have to repeat those steps, again and again, and then you’re going to ask yourself, “Why didn’t I just make this part of the code?”
Writing to Excel
- When one does a large simulation study or extensive analysis, one often has to summarise the tables because they are just too large to fit on a page
- Yet, most of the audience is familiar with spreadsheets, including filters, sorts, …
- Sometimes the best way to make your results interactive is to save it nicely in a spreadsheet
R has several nice packages for this, the best of which are openxlsx and openxlsx2.
Statistics assignments
- Personally, I’ve been using this approach for over a decade when creating assignments
- I generate data sets that test the outcomes I am targeting in a controlled way
- I add randomness so that each student gets different data (but similar results)
- If the randomness is small then it is still easy to mark, say with a rubric
- If the randomness is larger then you can then give the marker and students a parameterised Quarto document
- This means that each student has a personalised memo, specially just for them 😊
That’s right
Quarto documents can take inputs!
Cycling through students
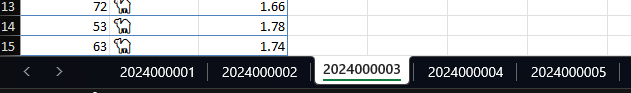
students <- c('2024000001', '2024000002', '2024000003', '2024000004',
              '2024000005') # Get class list in R somehow
# You can read student numbers from class list / mark list file:
# students <- openxlsx::read.xlsx('mark_list.xlsx', startRow = 4)$Student.ID
n <- 100
students |> lapply(\(s) {   # Make a list of data frames
  data.frame(
    Mark = rbinom(n, 100, 0.6),
    Group = c('🐬', '🐪') |> sample(n, replace = TRUE),
    Height = rnorm(n, 1.67, 0.1) |> round(2)
  )
}) |> setNames(students) |> # Give the data frames names
  openxlsx::write.xlsx('gen_data_3.xlsx',
        firstRow = TRUE, asTable = TRUE,
        colWidths = c(10, 11, 12) # or "auto"
) 
Sidenote to the sidenote
When you introduce R to people who haven’t used it before, where do you start?
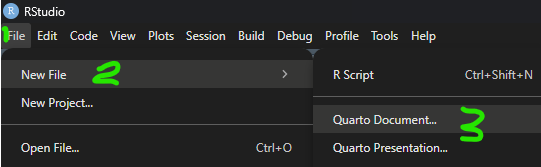
- I always start in RStudio, with File -> New File -> Quarto Document (or R Markdown)
- Just like with R Projects, RStudio will always and automatically set the working directory for you
- I do not waste an hour trying to explain working directories, I just tell students to put the data in the same folder as the .qmd or .Rmd file
- Relative referencing beats absolute referencing 99% of the time
- Forces some structure
- Encourages documentation and other good practices
- Increases alignment between code and results
Parameterised documents
At the start of each Quarto document is a YAML block. The only line that’s compulsory is the output line that says what format we want, e.g. Word, PDF, PowerPoint, Beamer, revealjs, etc.
- If we include parameters in the YAML then we can access them in the code, e.g. params$st
- We can set the parameter values via the “execute_params” input in the quarto::quarto_render function
- You can have a separate script that renders the document for each student, in a loop
- and even emails it to each student if you have the right permissions
- You can have a separate script that renders the document for each student, in a loop
Reference documents
- For Word and PowerPoint you can create a special formatting document called a reference document
- You do this by making a new Quarto document of the target type and rendering it without changing anything
- The content of this document is irrelevant so don’t change it
- In Word/PowerPoint, you modify the styles of the document, as well as settings like margins, paper size, header/footer, and language
- For future documents you copy the reference document in the same folder and the new document and reference it in the YAML
- The result is then that you new document renders in the desired style and settings
Conclusion to Part 2
- Don’t be flashy for the sake of being flashy (e.g. slow slide transitions)
- You’re going to just annoy yourself and distract the audience
- Think of your audience, the message you’re trying to convey, and then ask, “How can presentation technology support me in transferring information to my audience?”
This presentation was created using the Reveal.js format in Quarto, using the RStudio IDE. Background image created using image editor GIMP by compositing images from CoPilot.
If you’re eager to start Part 3
Try to create a basic Quarto document and render it.
- Type a title, your name, and select a format
- Find the “Render” button and click it (blue right arrow near the top with the word “Render” next to it)
2025/11/25 - MDAG